By trade, I am a UX designer. My heart beats for intuitive interfaces, consistent user experiences, and the question: How does a user get from A to B as easily as possible? For years, the answer in business software was always fairly straight forward: clear menus, learnable patterns, and efficient paths through the system. But is this question still relevant given the impact of AI on UX?
Artificial intelligence doesn’t just change what software can do. It changes how we work with software. This fundamentally reshapes our definition of what a ‘good user experience’ actually means.
The end of the classic user interface?
Let’s look at an everyday engineering example: You receive an email. Your supplier informs you that component #4711 will no longer be available starting in March. Previously, you would click through the bill of materials (BOM), manually search for where it is used, research alternatives in another system, create a change request, and notify colleagues via email. All of this takes hours, scattered across multiple tools.
Soon, you will only have to say: “Component #4711 is discontinued – what is affected and what are the alternatives?” The system independently checks all assemblies, suggests qualified replacement parts, and prepares the change request for approval.
Take it one step further into the future, and you won’t even have to ask. The system detects the impact itself, proactively suggests the change, and simply waits for your approval.
H2: New requirements for AI UX
This example illustrates the fundamental shift that AI capabilities and agents are currently ushering into engineering environments. It’s a transformation that upends much of what we’ve learned about UX.
The AI UX of tomorrow will no longer be measured by how intuitive an interface is to use. Instead, it will be measured by:
- …how well the system understands the user’s intent
- …how relevant the proactive suggestions are
- …how intelligently the automation works in the background
Simply put: The best UX will probably be the one that requires the least amount of interface interaction to get the job done.
Five principles redefine UX
What does this mean in practice? I see five shifts emerging—especially in the engineering environment.
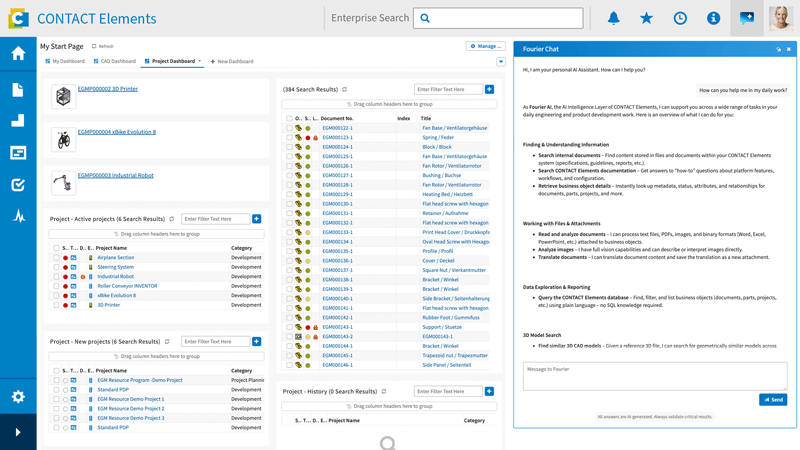
1. Conversation instead of clicks
Voice and text are becoming the primary interface. Not because clicking is bad, but because natural language is closer to our actual intent than any menu structure. A well-trained system understands what is meant—even if the phrasing isn’t perfect.
This requires a radical rethink: It is no longer about users learning how to navigate the interface. The system must learn to understand humans.
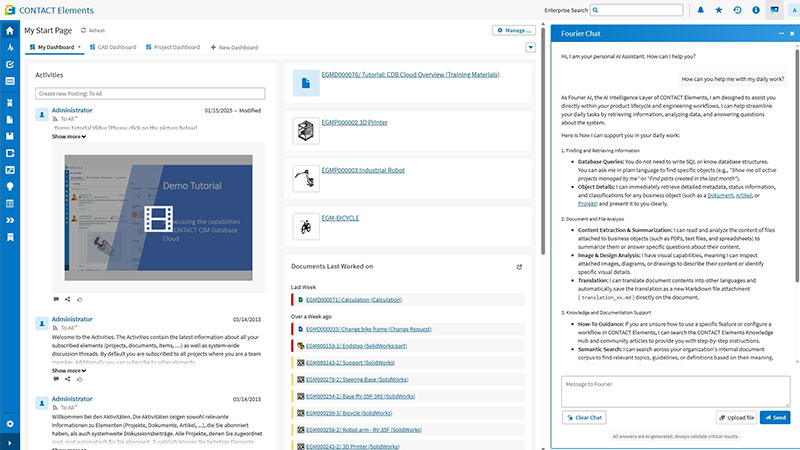
2. Proactive instead of reactive
Today’s software waits for input. Future systems act on their own: they identify risks before they arise, suggest actions before the user looks for them, and point out inconsistencies before they turn into problems.
A quality agent that monitors data streams and automatically initiates corrective action – this is not science fiction. It is a concrete architectural decision that can be made today.
3. Adaptive workspace – just in time
The interface configures itself based on role, task, and data context. A design engineer needs a different interface than a project manager or a quality assurance manager. And what you need at 9:00 AM might be completely different from what you need at 3:00 PM.
Intelligent systems adapt to the human – not the other way around.
4. Knowledge graph instead of keyword search
Classic search finds documents containing a keyword. Semantic search based on a knowledge graph understands relationships: Where is this component used? Which variants are affected? What changed in the last version?
This difference sounds technical, but it has immediate UX consequences: users no longer need to know exactly what to search for. The system delivers the right context.
5. Human-in-the-loop
As impressive as AI agents are, decision-making authority remains with humans – and it always should.
Good AI UX means finding the right moment for the system to pause and wait for human approval—not too early (which would be annoying), and not too late (which would be risky).
Human-in-the-Loop is not just a safety net. It is a design decision that builds trust.
A fleet of digital colleagues
One analogy helps me when I think about the future of working with AI: Imagine that instead of getting a new tool, you are getting new colleagues who take care of engineering and design, who specialize in quality and compliance, and keep an eye on the supply chain.
These digital agent-colleagues work silently in the background, orchestrated and coordinated with one another. They are not omnipresent, but they are always there when you need them.
This changes not only the work itself, but also our relationship with software. A tool that must be operated becomes a partner that thinks ahead.
What this means in practice
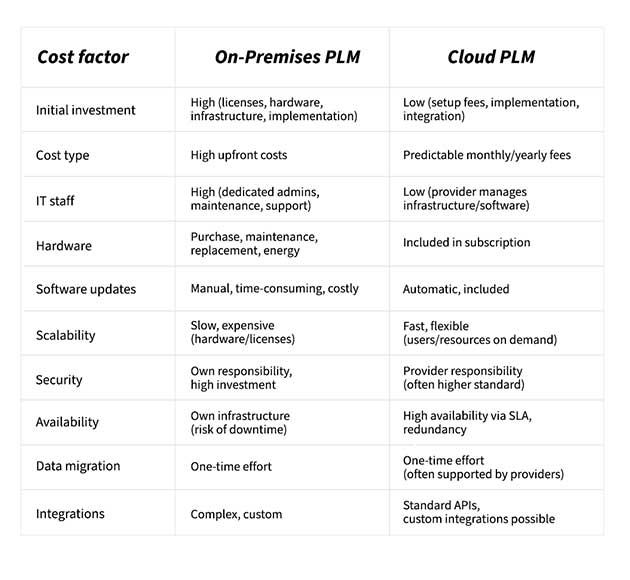
These changes won’t happen overnight, and they are not a given. Anyone who wants to benefit from intelligent UX needs the right foundation: structured data and clear governance. And a system that views AI not as an add-on, but as an integral component.
The quality of AI outputs is directly dependent on the quality of inputs. An agent accessing unstructured or incomplete data will deliver unreliable results and poor UX, no matter how well-designed the interface is.
That is why my key takeaway from my work over the last few months is: Investments in data quality and platform architecture are investments in User Experience.
Putting people at the center
AI changes the interface, but not the objective. Technology should empower people to do their jobs well. With less friction, more context, and stronger foundations for decisions.
The fact that this will happen in the future via conversation instead of clicks, proactive suggestions instead of empty text fields, and semantic connections instead of keyword searches is not a threat to good UX design. It is an invitation to rethink what “intuitive” actually means.
Deploy AI the right way
Artificial intelligence only delivers real impact when AI features are systematically and valuably integrated into your processes. Discover how this works in our AI Insights. This newsletter provides you with tangible real-world examples, best practices, and valuable tips on all aspects of engineering and manufacturing intelligence.