Numbers, please! Energy efficiency is measurable

Energy is cheapest and most environmentally friendly if we do not consume it in the first place. Therefore, energy efficiency makes a significant contribution to the energy transition, and we have already tapped into savings potential in many areas: LEDs are now standard and energy-intensive devices like old refrigerators or water heaters have either been replaced or switched off. At CONTACT, we have initiated a project to optimize energy efficiency in office buildings. It is surprising how much saving potential still exists, even though employees are already conscientious in their resource usage. By replacing electrical devices and air conditioning in the server room, as well as turning off and merging old servers, energy consumption has been reduced by 50 %. This is not only ecologically sensible but also economically beneficial. A lot can be achieved with little effort, provided consumption data can be logged and visualized.

Energy efficiency is not possible without software

The German government’s report on “Energy Efficiency in Numbers” provides an overview of the final energy consumption in Germany for sectors such as industry, transportation, private households, and commerce/trade/services.

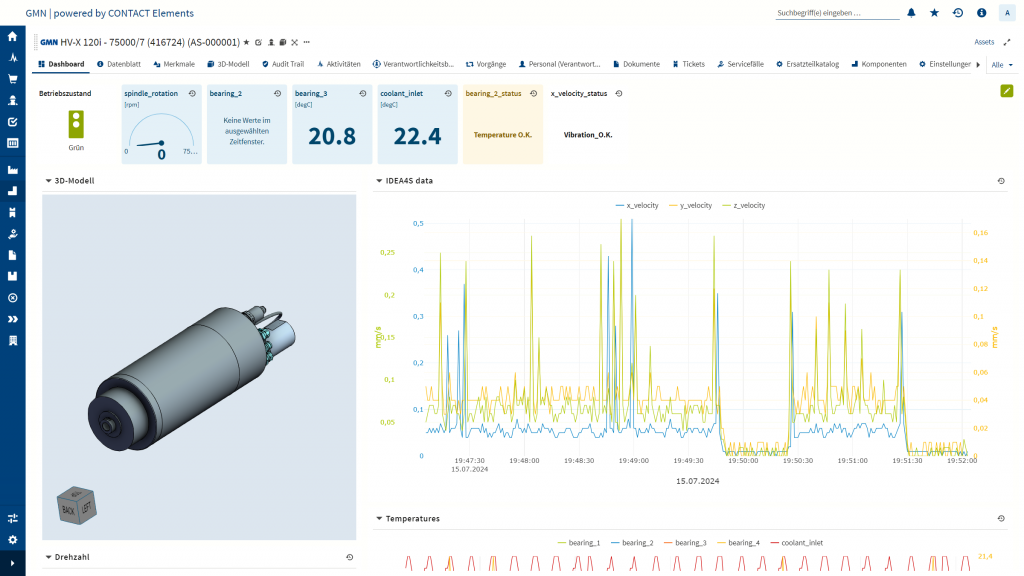
Nearly a third of Germany’s final energy consumption comes from industrial processes. To achieve efficiency improvements here, it is essential to examine them more closely. A significant portion of energy (about two-thirds) is attributed to process heat, which is used, for example, in the production of products. To identify which facilities and machines in the production hall have saving potential, monitoring and controlling are necessary. Our software platform, Elements for IoT, provides companies with the ability to monitor, graphically represent, and analyze their consumption data. Data from metering points, such as those measuring power consumption, can be assigned to individual machines and production processes. Additionally, it is possible to process sensor values and machine control states and merge them into a digital twin of the machine. For the specific requirements of energy management, we have developed a new module that represents a continuous improvement process of energy performance indicators (according to ISO 50001). Starting from energy consumption, broken down by different energy types such as electricity or compressed air for a machine on the shopfloor, consumption values can be calculated down to a manufactured unit of the product. This also provides the opportunity to calculate the CO2 footprint of the manufactured product. The following example of a dashboard for a production facility shows a summary of a shift and provides information on energy consumption for the production process, as well as the average consumption for each manufactured unit from that shift.

Energy efficiency in production

Energy performance indicators can be used in various ways and are particularly important for audits according to ISO 50001. These audits require proof of a continuous improvement process. In addition to implementing sustainability concepts, this simultaneously saves resources such as electricity or gas.

Furthermore, energy information can be used to calculate the CO2 footprint, which can then be exchanged across supply chains. In the context of this data exchange, we implement the concept of the Asset Administration Shell to integrate the submodel for the CO2 footprint into our IoT platform.

Energy consumption data can also be useful in the manufacturing industry to optimize production processes. By assigning energy consumption data to the processes happening simultaneously, analyses show which sections are particularly energy intensive. Often, the usual metering interval of 15 minutes is not sufficient and higher time resolution data is required. Smart meters allow for sampling rates in the minutes or even seconds range, facilitating analyses that help optimize production processes.

AI-based forecasts for energy consumption

Interestingly, machines on the shopfloor are often found in standby mode, waiting for the next production order, even when there are no orders for the next few hours or the upcoming weekend. Optimized machine shutdowns which consider ramp-up times can directly save energy costs. A specific example of this is the implementation of an alarm mechanism that informs machine operators based on planned tool changes, services, or manufacturing orders about when it is advisable to shut down the machine. Additionally, the machine dashboard displays when the next order is due. Historical data studies have shown that for machines equipped this way, electricity cost savings can amount to about 23%. In the dashboard shown below, the shutdown recommendation is visualized by the red traffic light. It also indicates by how many kilowatt-hours the predicted value deviates from the actual measured power consumption.

The forecast of electricity consumption is based on decision trees and directly implemented in the platform. Consumption data is accessed through the digital twin of the machine. The forecast’s inference model uses data from planned manufacturing orders, including time data and information on the material to be produced, to calculate the expected electricity consumption in kilowatt-hours. If the actual measured value deviates from the forecast by a fixed limit, the system informs the responsible person(s) with a red traffic light on the dashboard.

Furthermore, peak management uses forecasts to avoid load peaks. If multiple machines or systems are in operation simultaneously at a production site, this can lead to overlapping peaks in energy demand, resulting in higher fees. Based on forecasts of the electricity consumption, it is often possible to optimize execution times and machine occupancy to evenly distribute energy consumption and prevent expensive penalty payments.

Digitalization for the High Seas

The sun is shining in Hamburg, and the mild autumn air is in motion – even though I am perfectly equipped for rainy weather. In early October, shipbuilders from around the world gather in a conference hotel near the harbor for the CADMATIC Digital Wave Forum. The user meeting invites participants to experience CADMATIC’s CAD application for shipbuilding firsthand and to learn about current trends, product innovations, and new developments. The highlight: CADMATIC Wave, an integrated CAD/PLM solution specifically designed for shipbuilding and jointly developed by CADMATIC and CONTACT.

Model visualization simplifies data retrieval and collaboration

After our first coffee, we slowly make our way into the conference hall. The morning is filled with numbers and facts around CADMATIC’s digitalization strategy. In the afternoon, our Managing Director Maximilian Zachries presents CADMATIC Wave to the 200 participants. As we demonstrate the first functionalities of the integrated Product Data Management (PDM), some attendees quickly pull out their phones to snap a photo of the feature. I am somewhat excited – now it’s official. Now we also need the data model. And that isn’t quite so simple.

Cadmatic's Atte Peltola introduces the audience to Cadmatic Wave

CADMATIC’s Atte Peltola presents CADMATIC Wave. (© CADMATIC)

The resounding call for a data model for shipbuilding carries me through the three days in Hamburg. During my conversations with industry colleagues, it becomes evident that the information required and generated in the shipbuilding process must be able to be mapped within the model. Model-centric is the magic word: the ship’s geometry is visualized, including equipment, fittings, and logistics. Information can then be retrieved and added via the specific parts of the model. Model visualizations provide a shared and intuitive view of the ship for all involved trades, significantly simplifying information retrieval. This enhances the efficiency of engineering activities and collaboration, also with partners.

Basing a data model on ship geometry is challenging

Engaged in a discussion with a research associate from the Norwegian University of Science and Technology (NTNU), we stumble upon a question: Is the geometry model even suitable for generating a generic product structure for data storage in the PDM? After all, as a placeholder in a data model, there are quite a few locations in such a ship. And let me put it this way: data models are typically organized along the processes in product creation, not the geometry of a ship model. I am curious to see how we will solve this challenge in CADMATIC Wave.

The evening event takes place on the Cap San Diego, a museum ship in the Hamburg harbor. The rustic flair of a ship’s belly and the lavish buffet create a cozy atmosphere for lively conversations. We talk about life in Finland and Norway and the difference between information and data management. The evening ends stormy and rainy, and I finally put my rain gear to good use and return to the hotel dry and warm.

SEUS brings European shipbuilding to a new efficiency level

At the CADMATIC Digital Wave Forum, I also meet my consortium partners from the Smart European Shipbuilding (SEUS) project for the first time. Among them are representatives from NTNU and CADMATIC, as well as employees from two shipyards, the Norwegian Ulstein Group and the Spanish Astilleros Gondan SA. SEUS is an EU-funded research project with the goal of developing an integrated CAD and PLM solution for shipbuilding. This endeavor goes way beyond the functionalities we develop in CADMATIC Wave. For instance, we aim to incorporate knowledge management and utilize AI for searching within product data.

In this context, the broad positioning of our research department, CONTACT Research, works to our advantage. Our focus areas include not only Digital Lifecycle Management, where we conduct research on digitalization strategies for various industries, but also Artificial Intelligence. The AI product data search we aim to implement in SEUS allows us to bring our self-declared motto to life: “Bringing artificial intelligence into the engineering domains.”

As three days in Hamburg come to an end, three strong impressions remain:

  1. It is necessary to design an abstract data model for shipbuilding. One that contains the modules of a ship and yet can be customized to fit the specific needs of any shipbuilder. This data model must be closely linked to the development process.
  2. Personal exchange and meeting each other face to face have been an enriching experience for me in this new work area. This positive feeling motivates me for my future work in the SEUS project.
  3. In Hamburg, rain gear is a must.

Asset Administration Shell as a catalyst of Industry 4.0

“Country of poets and thinkers” or ” Country of ideas”: Germany is proud of its writers, scientists, researchers, and engineers. And of its meticulous bureaucracy, which aims for absolute precision in statements or indications. Combined, this often results in awkward word creation when naming technical terms. A current example of this is the “Verwaltungsschale” (literally: administration shell), whose innovative potential and central relevance for Industry 4.0 are not immediately apparent.

What exactly is a “Verwaltungsschale”?

The “Verwaltungsschale” is not a dusty administrative authority, but the very German translation of the English term “Asset Administration Shell” (AAS). The AAS is a standardized complete digital description of an asset. An asset is basically anything that can be connected as part of an Industrie 4.0 solution (for example, plants, machines, products as well as their individual components). It contains all information and enables the exchange and interaction between different assets, systems, and organizations in a networked industry. Therefore, it is pretty much the opposite of a sluggish authority and currently the buzzword in digital transformation.

As with many new topics, definitions of AAS vary and are quite broad. From very specific like the Asset Administration Shell as an implementation of the digital twin for Industry 4.0 to the loose description of AAS as a data plug or integration plug for digital ecosystems.

I prefer the representation of the AAS as a metamodel for self-describing an asset. With this metamodel, further models can be generated to provide collected information. Through the use of software, these models are then “brought to life” and are made available to others via interfaces.

Concept and usage of the Asset Administration Shell

As a digital representation of an asset, the AAS provides information or functions related to a specific context through its submodels. Examples include digital nameplates, technical documents, the component or asset structure, simulation models, time series data, or sustainability-relevant information such as the carbon footprint. The information is generated along the various phases of the lifecycle, and it depends on the specific value network which asset information is of importance. Thus, submodels are initially created in certain lifecycle phases, specified and elaborated in subsequent phases, and enriched or updated with information in the further process. Thereby, the AAS refers to either a very generic (type) or a very concrete (instance) representation of an asset.

As assets change over time (as-defined, as-designed, as-ordered, as-built, as-maintained), so does the Asset Administration Shell. Thus, multiple AASs can exist for the same asset over the lifecycle. In order to utilize the information in the AAS within its value network, it needs to be accessible. Access is usually given via the Internet or via the cloud (repository-deployed AAS). In intelligent systems, the management shell can also be part of the asset itself (asset-deployed AAS).

Information can be exchanged in various ways. Either via files, so-called AASX files (AAS type 1), via a server-client interaction such as RestAPI (AAS type 2) or via peer-to-peer interaction (AAS type 3), in which the AASs communicate independently using the so-called I4.0 language and perform tasks cooperatively.

While type 1 and 2 take a passive role in the value network and are more likely to be used with repository-held AAS, type 3 describes an active participation in the value network and is more likely to be used with asset-held AAS running smart products.

Common standards connect!

No matter what type of Asset Administration Shell you choose: Important is that the recipient and the provider speak the same language. To achieve this, the exchange of concrete information must be standardized. Considering the amount of different industries, scenarios, assets, and functions, this is an immense number of submodels that need to be standardized. Organizations and associations such as the Industrial Digital Twin Association (IDTA), formed by research institutes, industrial companies, and software providers, are tackling this mammoth task. The rapidly growing number of members as well as the lively exchange at trade fairs and conferences among each other illustrate the potential for the industry. It is important not to leave SMEs behind, but to involve them in the standardization work in the best possible way.

Conclusion

The Asset Administration Shell is at the core of successful Industrie 4.0 scenarios. It enables manufacturer-independent interoperability and simplifies the integration of all types of assets into a collaborative value network. It increases efficiency within production processes by providing complete transparency of the real-time status of each asset. And it also offers a comprehensive security concept to protect the data. Within a very short time, the AAS has thus transformed from a theoretical construct to a real application in practice. Together with partners from research and industry, we are working within the ESCOM and Flex4Res research projects to make it usable on an industrial scale.