Energy is cheapest and most environmentally friendly if we do not consume it in the first place. Therefore, energy efficiency makes a significant contribution to the energy transition, and we have already tapped into savings potential in many areas: LEDs are now standard and energy-intensive devices like old refrigerators or water heaters have either been replaced or switched off. At CONTACT, we have initiated a project to optimize energy efficiency in office buildings. It is surprising how much saving potential still exists, even though employees are already conscientious in their resource usage. By replacing electrical devices and air conditioning in the server room, as well as turning off and merging old servers, energy consumption has been reduced by 50 %. This is not only ecologically sensible but also economically beneficial. A lot can be achieved with little effort, provided consumption data can be logged and visualized.
Energy efficiency is not possible without software
The German government’s report on “Energy Efficiency in Numbers” provides an overview of the final energy consumption in Germany for sectors such as industry, transportation, private households, and commerce/trade/services.
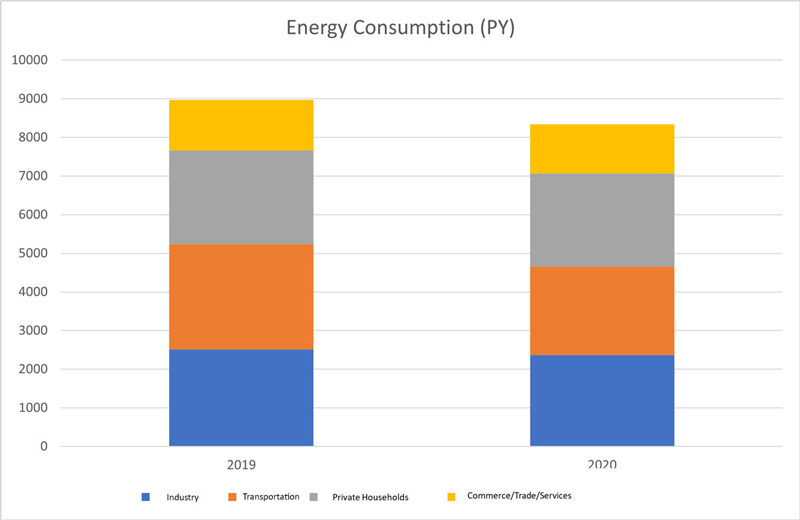
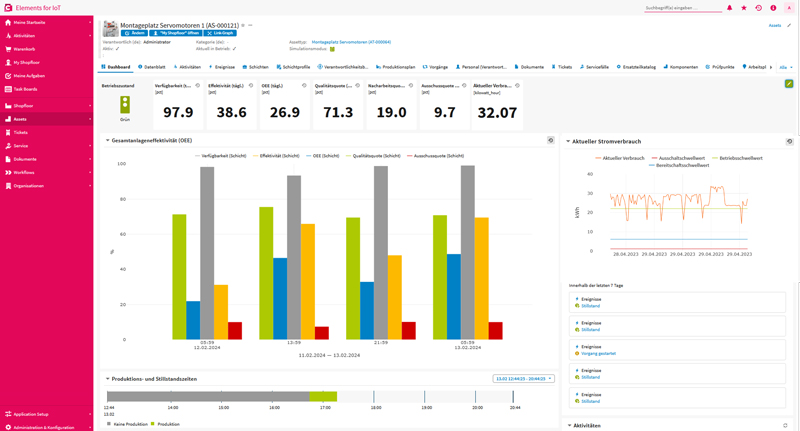
Nearly a third of Germany’s final energy consumption comes from industrial processes. To achieve efficiency improvements here, it is essential to examine them more closely. A significant portion of energy (about two-thirds) is attributed to process heat, which is used, for example, in the production of products. To identify which facilities and machines in the production hall have saving potential, monitoring and controlling are necessary. Our software platform, Elements for IoT, provides companies with the ability to monitor, graphically represent, and analyze their consumption data. Data from metering points, such as those measuring power consumption, can be assigned to individual machines and production processes. Additionally, it is possible to process sensor values and machine control states and merge them into a digital twin of the machine. For the specific requirements of energy management, we have developed a new module that represents a continuous improvement process of energy performance indicators (according to ISO 50001). Starting from energy consumption, broken down by different energy types such as electricity or compressed air for a machine on the shopfloor, consumption values can be calculated down to a manufactured unit of the product. This also provides the opportunity to calculate the CO2 footprint of the manufactured product. The following example of a dashboard for a production facility shows a summary of a shift and provides information on energy consumption for the production process, as well as the average consumption for each manufactured unit from that shift.
Energy efficiency in production
Energy performance indicators can be used in various ways and are particularly important for audits according to ISO 50001. These audits require proof of a continuous improvement process. In addition to implementing sustainability concepts, this simultaneously saves resources such as electricity or gas.
Furthermore, energy information can be used to calculate the CO2 footprint, which can then be exchanged across supply chains. In the context of this data exchange, we implement the concept of the Asset Administration Shell to integrate the submodel for the CO2 footprint into our IoT platform.
Energy consumption data can also be useful in the manufacturing industry to optimize production processes. By assigning energy consumption data to the processes happening simultaneously, analyses show which sections are particularly energy intensive. Often, the usual metering interval of 15 minutes is not sufficient and higher time resolution data is required. Smart meters allow for sampling rates in the minutes or even seconds range, facilitating analyses that help optimize production processes.
AI-based forecasts for energy consumption
Interestingly, machines on the shopfloor are often found in standby mode, waiting for the next production order, even when there are no orders for the next few hours or the upcoming weekend. Optimized machine shutdowns which consider ramp-up times can directly save energy costs. A specific example of this is the implementation of an alarm mechanism that informs machine operators based on planned tool changes, services, or manufacturing orders about when it is advisable to shut down the machine. Additionally, the machine dashboard displays when the next order is due. Historical data studies have shown that for machines equipped this way, electricity cost savings can amount to about 23%. In the dashboard shown below, the shutdown recommendation is visualized by the red traffic light. It also indicates by how many kilowatt-hours the predicted value deviates from the actual measured power consumption.
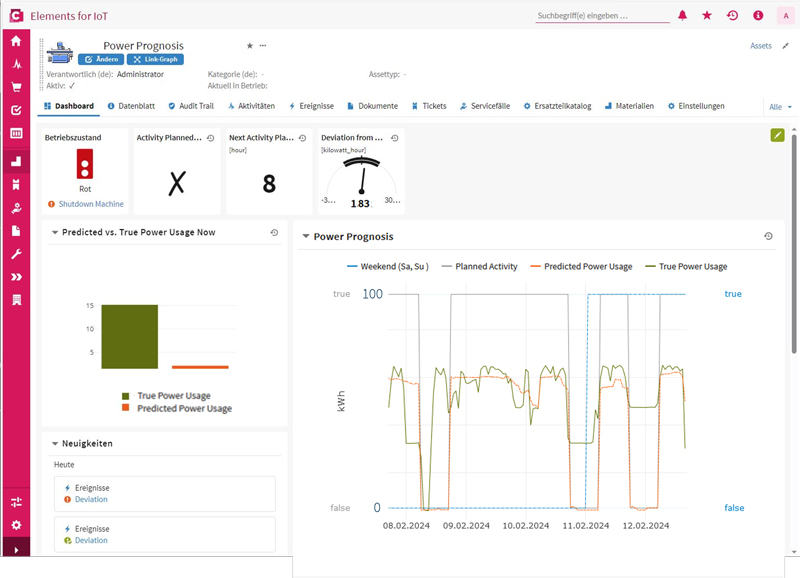
The forecast of electricity consumption is based on decision trees and directly implemented in the platform. Consumption data is accessed through the digital twin of the machine. The forecast’s inference model uses data from planned manufacturing orders, including time data and information on the material to be produced, to calculate the expected electricity consumption in kilowatt-hours. If the actual measured value deviates from the forecast by a fixed limit, the system informs the responsible person(s) with a red traffic light on the dashboard.
Furthermore, peak management uses forecasts to avoid load peaks. If multiple machines or systems are in operation simultaneously at a production site, this can lead to overlapping peaks in energy demand, resulting in higher fees. Based on forecasts of the electricity consumption, it is often possible to optimize execution times and machine occupancy to evenly distribute energy consumption and prevent expensive penalty payments.
With the data from a digital twin, companies can increase the efficiency of energy-intensive production facilities. Especially when they also use AI. The added value that this combination creates for energy management in companies is explained by Dr Nicole Göckel and Johann Heinrich in the technical article ‘Increasing yield with digital twins’.